Psychology and Cognitive Science
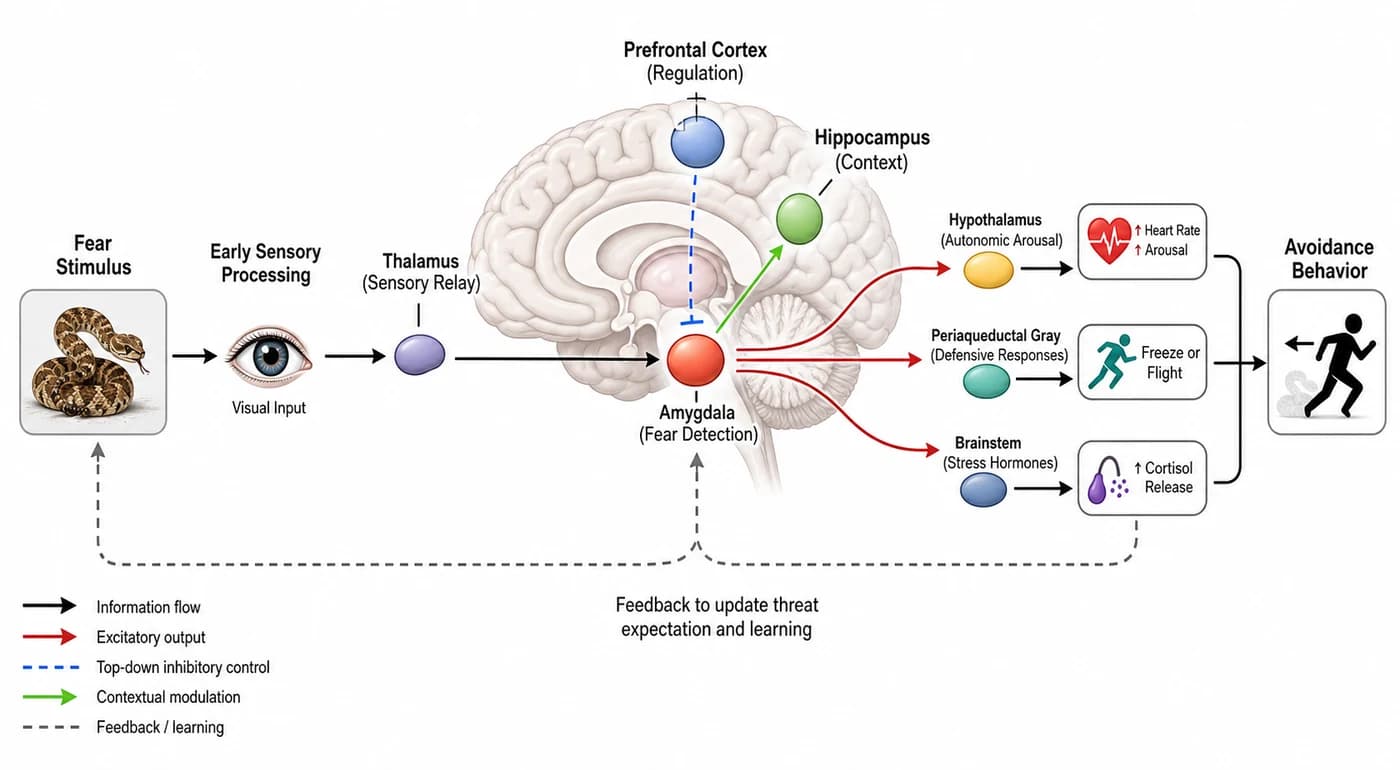
Fear stimulus activating the amygdala and driving avoidance behavior
Explore this Brain-behavior relationship diagram example for Psychology and Cognitive Science. Use its prompt as a starting point, then refine labels, regions, and layout in FigRay.
Prompt used for this figure
Create a publication-ready Brain-behavior relationship diagram for Psychology and Cognitive Science, using the specific case: "Fear stimulus activating the amygdala and driving avoidance behavior". The figure should be built around this concrete example, not a generic template. Clearly show the key entities, process steps, directional arrows, causal relationships, compartments or layers when relevant, and a concise legend. Use a clean scientific vector-illustration style, white background, restrained colors, accurate English labels, and a layout suitable for a journal Figure 1, methods figure, or graphical abstract. Additional rendering constraints: Do not add a large title, headline, caption, or any top-left title text. Do not include boxed legends, section headers, explanatory callout boxes, protocol paragraphs, or decorative background elements. Use only concise English labels attached directly to objects, arrows, axes, tracks, samples, tissues, molecules, or data marks. Build the figure around the specific case: "Fear stimulus activating the amygdala and driving avoidance behavior". Keep the layout clean, readable, and suitable for direct use in a scientific web gallery. Use white background, restrained colors, crisp labels, clear visual hierarchy, and polished publication-ready scientific illustration or data-figure styling.